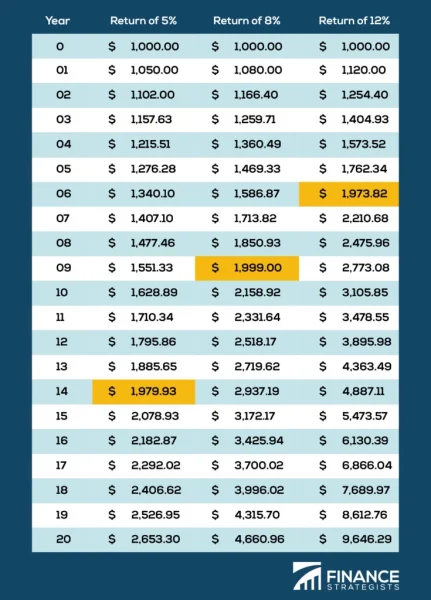
The Rule of 72 is a mathematical formula that almost seems unbelievable. When investing, if you divide 72 by your average annual interest percentage, this gives you the number of years it will take to double your initial investment. Putting this number into context makes such a phenomenon even crazier. The overall stock market has provided an average return of 10.13% annually over the last 30 years. Applying the Rule of 72 shows that it takes around seven years to double your money when investing in the overall stock market.
The younger you are, the more profound this figure is. An 18-year-old who retires at the average age of 62 years old in the US has 44 years for their money to grow, assuming they take all of their money out as soon as they retire. This allows them to double their investment just over six times, with each double compounding on each other. Let’s say this 18-year-old just graduated high school and got a gift of $1,000. They invest their money and earn an average return of 10.13% every year until they retire at 62. This means their $1,000 will have turned into over $64,000, a very impressive increase.
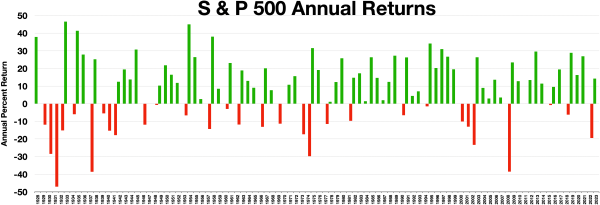
When I say the broader stock market, I am referring to the Standard & Poor’s 500 Index (S&P500), which is a weighted collection of 500 of the largest publicly traded companies in the US. Considered one of the greatest and most accurate gauges of the US stocks, the index provides valuable insight into the overall economic performance of the US during a given period. The S&P500 has provided remarkably sustainable returns to investors over the long run (up over 700% since 1997) and has, since 1957 (the index’s conception date), gone through the leadership of a baker’s dozen presidents (not including our newly elected president, Donald Trump).
With this, it is interesting, although maybe not particularly meaningful, to look at the average stock market return under each of these presidents, and group them by performance under party affiliation. To make such a comparison, the performance of the S&P500 will be used, given its reputation as a well-grounded indicator of the broader financial markets in the US throughout time. Over the years, when breaking up the return of the S&P500 into each year since 1957, the index has provided a median of 12.9% returns under Democratic presidents and a lower median of 9.9% under Republican presidents. In another analysis, Democratic presidents provided an average annual return of 11.5%, while Republican presidents had a lower 7.1% return. While the figure of performance changes based on the years analyzed, how the years are grouped, and what statistical calculation is being conducted, almost always, Democratic presidents boast a more successful S&P500 performance over the long term compared to Republican presidents.

Bill Clinton’s presidency (1993-2001) according to Kiplinger.com experienced the greatest rise in the stock market, with an average return of 15% per year when he was in power. Clinton was a Democrat. Was this success in the stock market due to his party affiliation, seeing how Democrats have had greater market success historically? No, definitely not. Clinton was president during one of the most substantial economic booms in the history of the US known as the “dot-com” bubble, that inflated markets heavily. By the end of his service, the S&P500 rose just over 211%

On the other side of the spectrum, George W. Bush is burdened with the worst performance of the stock market according to Kiplinger.com, with a -5.6% return per year during his presidency. George W. Bush was a Republican. Was this collapse of the market because of his affiliation with the Republican party? Again, no. Crushed with the popping of the dot-com bubble created under Clinton’s presidency, slaughtered by September 11, 2001, and razed by the collapse of the housing and banking markets, George W. Bush suffered a series of very unfortunate events. In the end, the S&P500 suffered a lugubrious near -40% drop.
Ultimately, the political affiliation of the president, in reality, has little to do with the overall performance of the stock market. While it can be interesting to note trends, such as Democratic presidents slightly outperforming Republican presidents, one must analyze the thousands of other micro and macroeconomic factors that have a more true and profound impact on the stock market. Remember, correlation does not equal causation.